Combined Comfort Control and Energy Monitoring
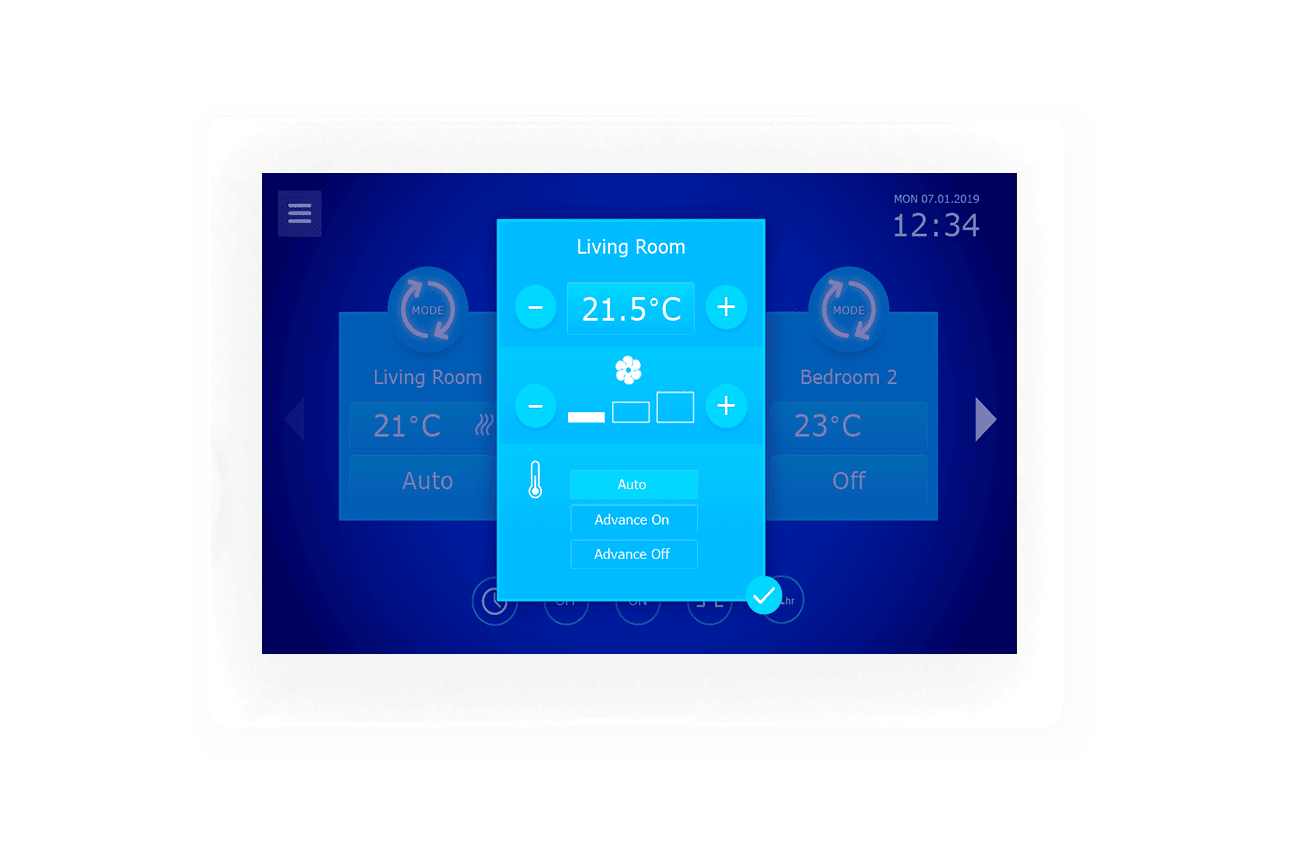
The Central Control Screen combines intuitive multi-zone comfort control adjustment with a smart energy monitoring display when energy meters are connected to the Titan Products residential solution.
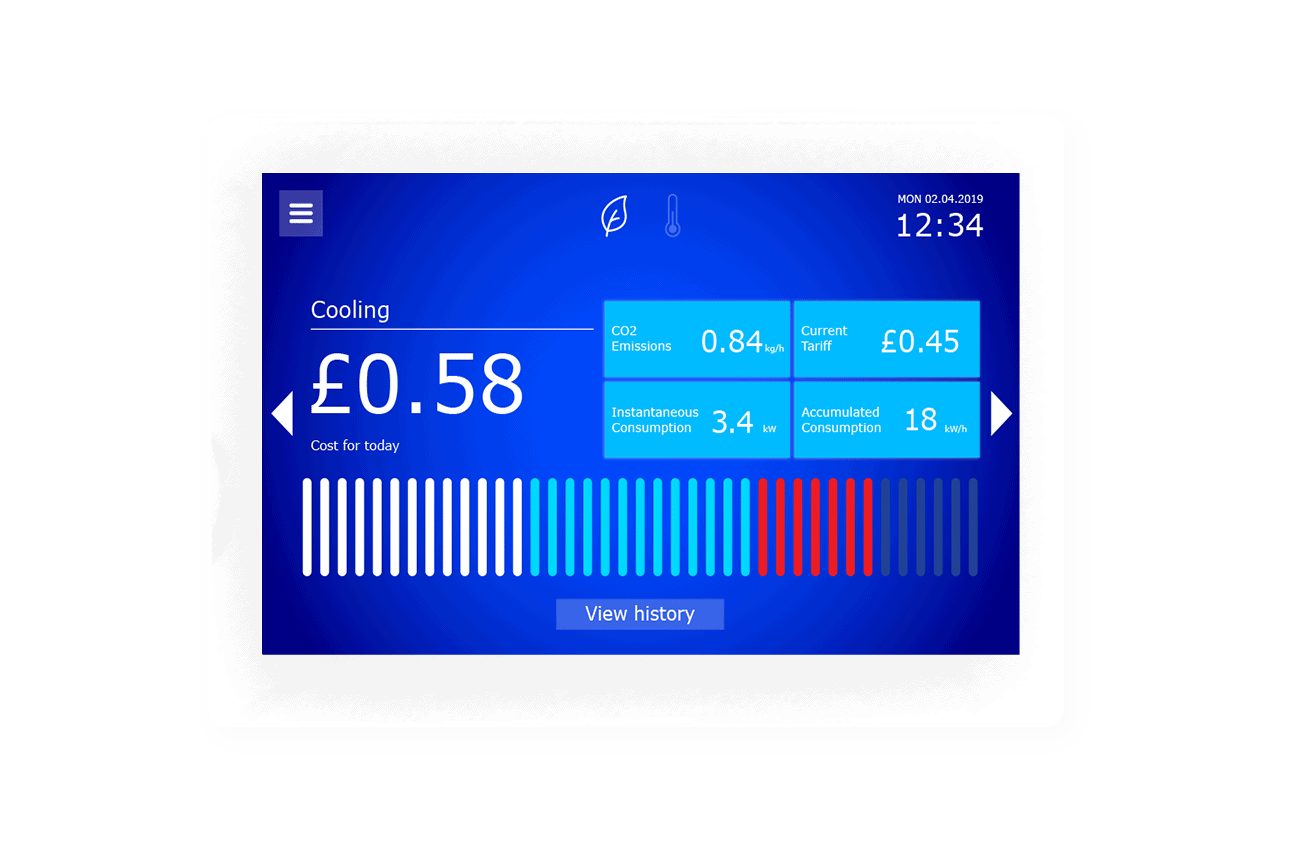
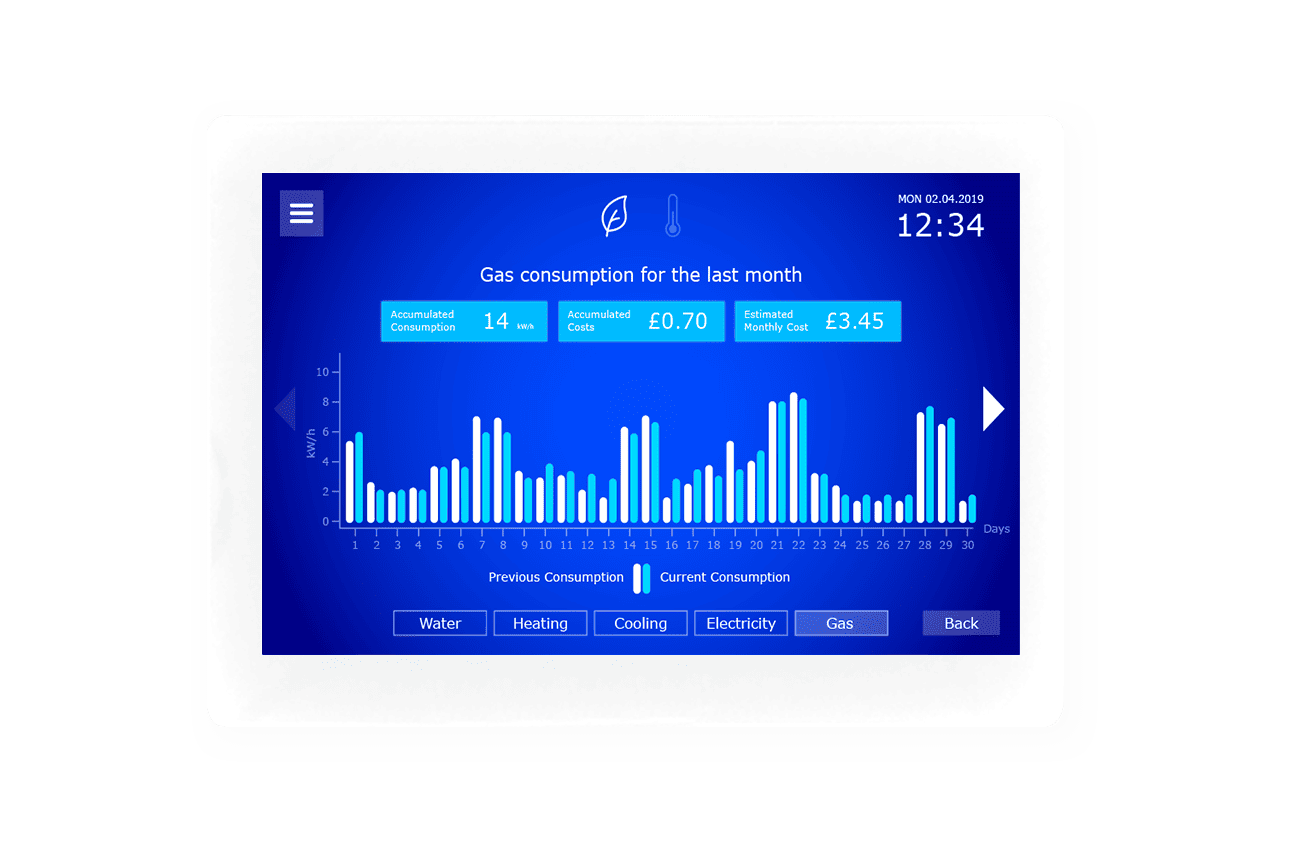
By offering both comfort control adjustment and smart metering capabilities from a single user interface, the Titan Products solution can significantly reduce hardware and installation costs, while providing an excellent user experience via a fully integrated and feature-rich combined comfort control and energy monitoring solution.
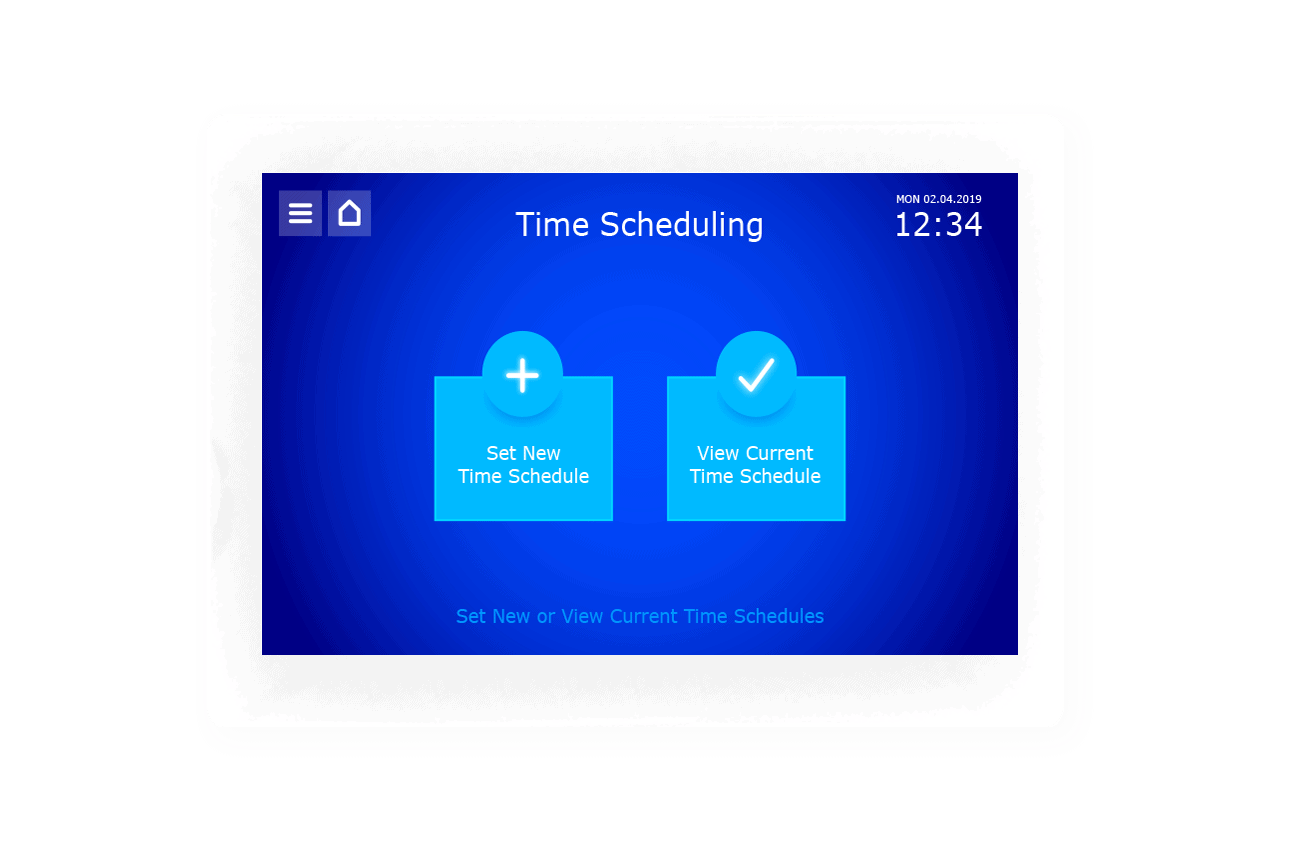

Flexible time schedules and holiday periods

Multi-room comfort control adjustment

Reduced installation time and costs from plug & play setup

Smart metering display options

Key Features
- Adjust temperature/control modes of all rooms from a central location
- Set up flexible time schedules for any zone
- Wi-Fi or wired IP communication solutions
- Set up holiday periods
- Branded screens available
- 7 inch wall mounted screen